This module allows you to:
- Display Box plot, Scatter plot; create and compute Correlation table, Distribution chart and Statistics of selected blocks, samples or points.
- Display the statistics of the selected objects.
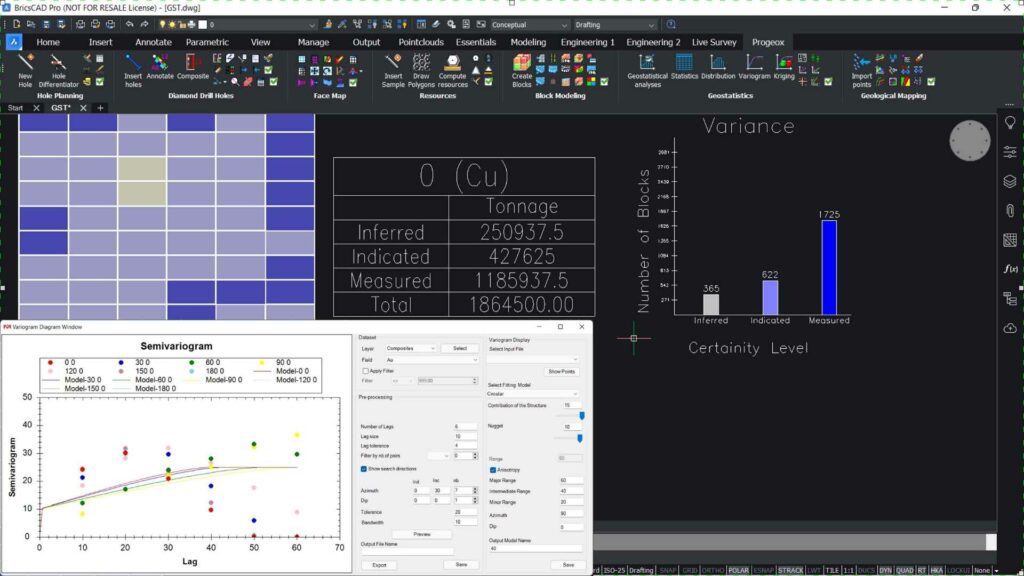
- Create a grade distribution chart.
- Compute variograms from drawing sample.
- Estimates grades using the geostatistical method of kriging and generates block models from those estimations.
- Display the scatter plot of two grades.
- Display the box plot of a grade.
- Display the grade-tonnage curve of a set of blocks.
- Evaluate the correlation of diferents properties.
- Assign decluster weights to GMP points.
- Perform a cut-off grade analysis on the selected blocks and color them according to their profitability.